Categorieën in Gorredijk
Industries
Bedrijfsdistributie per sector in Gorredijk
| Industrie omschrijving | Aantal bedrijven | Gemiddelde leeftijd van het bedrijf |
|---|---|---|
| Bouw van gebouwen | 95 | — |
| Corporate management | 62 | — |
| Winkelen | 57 | 35 year |
| Bouw anders | 34 | — |
| Algemene Aannemers | 29 | — |
| Schoonheidsalons | 26 | — |
| Autogarage | 23 | — |
| Kledingwinkels | 23 | — |
| Onroerend Goed | 22 | — |
| Groothandel bouwmaterialen | 22 | — |
| Electronicawinkel | 22 | — |
| Gespecialiseerde ontwerpen | 21 | — |
Feiten over Gorredijk
| Gebied | 12.7 km² |
| Bevolking | 7.781 |
| Mannelijke bevolking | 3.887 (50.0%) |
| Vrouwelijke bevolking | 3.894 (50.0%) |
| Bevolkingsverandering (1975 to 2020) | +5.2% |
| Bevolkingsverandering (2000 to 2020) | +1.7% |
| Gemiddelde leeftijd | 42.6 jaar (Man: 41.8, Vrouw: 43.3) |
| Netnummers | 513 |
| Buurten | Oosterpoortbuurt |
| Lokale tijd | |
| Tijdzone | Midden-Europese zomertijd |
| Breedte- & lengtegraad | 53.00659, 6.06402 |
| Postcodes | 8401 |
Kaart van Gorredijk
Interactieve kaart
Bevolking van Gorredijk
Jaren 1975 tot 2020
| Data | 1975 | 1990 | 2000 | 2015 | 2020 |
|---|---|---|---|---|---|
| Bevolking | 7.394 | 7.268 | 7.648 | 7.744 | 7.781 |
| Bevolkingsdichtheid | 582,8 / km² | 572,8 / km² | 602,8 / km² | 610,4 / km² | 613,3 / km² |
Bevolkingsverandering van Gorredijk van 2000 tot 2015
Stijging van 1.3% van jaar 2000 tot 2015
| Locatie | Verandering sinds 1975 | Verandering sinds 1990 | Verandering sinds 2000 |
|---|---|---|---|
| Gorredijk | +4.7% | +6.5% | +1.3% |
| Friesland | +18.8% | +9.6% | +4.1% |
| Nederland | +24.3% | +13.4% | +6.5% |
Mediane leeftijd in Gorredijk
Mediane leeftijd: 42.6 jaar
| Locatie | Gemiddelde leeftijd | Mediane leeftijd (vrouw) | Mediane leeftijd (mannelijk) |
|---|---|---|---|
| Gorredijk | 42.6 yrs | 43.3 yrs | 41.8 yrs |
| Friesland | 41.9 yrs | 42.9 yrs | 41 yrs |
| Nederland | 41 yrs | 41.7 yrs | 40.2 yrs |
Bevolkingsdichtheid van Gorredijk
Bevolkingsdichtheid: 613 / km²
| Locatie | Bevolking | Gebied | Dichtheid |
|---|---|---|---|
| Gorredijk | 7.781 | 12,7 km² | 613 / km² |
| Friesland | 653.256 | 5.751,4 km² | 114 / km² |
| Nederland | 16,9 million | 41.398,3 km² | 409 / km² |
Historische en geprojecteerde bevolking van Gorredijk
Geschatte bevolking van 0 tot 2100
- JRC (European Commission's Joint Research Centre) werken aan de GHS built-up grid
- CIESIN (Center for International Earth Science Information Network)
- [Link] Klein Goldewijk, K., Beusen, A., Doelman, J., and Stehfest, E.: Anthropogenic land use estimates for the Holocene – HYDE 3.2, Earth Syst. Sci. Data, 9, 927–953, https://doi.org/10.5194/essd-9-927-2017, 2017.
Netnummers
Percentage gebiedscodes gebruikt door bedrijven in Gorredijk
Prijsverdeling
Bedrijfsspreiding voor Gorredijk
Human Development Index (HDI)
Statistische samengestelde index van levensverwachting, opleiding en inkomen per hoofd van de bevolking.
CO2-uitstoot van Gorredijk
Kooldioxide (CO2) -emissies per hoofd van de bevolking in ton per jaar
| Locatie | CO2 uitstoot | CO2-uitstoot per hoofd van de bevolking | CO2-emissie-intensiteit |
|---|---|---|---|
| Gorredijk | 87,518 tn | 11.25 tn | 6,898 tons/km² |
| Friesland | 4,518,084 tn | 6.92 tn | 785.6 tons/km² |
| Nederland | 167,743,568 tn | 9.91 tn | 4,051.9 tons/km² |
| CO2-uitstoot 2013 (ton/jaar) | 87,518 tn |
| CO2-uitstoot 2013 (ton/jaar) per hoofd van de bevolking | 11.25 tn |
| CO2-uitstootintensiteit 2013 (ton/km²/jaar) | 6,898 tons/km² |
Natuurlijk gevarenrisico
Relative risk out of 10
| Gevaar | Risk Level |
|---|---|
| Flood | Medium (4) |
* Risk, particularly concerning flood or landslide, may not be for the entire area.
- Dilley, M., R.S. Chen, U. Deichmann, A.L. Lerner-Lam, M. Arnold, J. Agwe, P. Buys, O. Kjekstad, B. Lyon, and G. Yetman. 2005. Natural Disaster Hotspots: A Global Risk Analysis. Washington, D.C.: World Bank. https://doi.org/10.1596/0-8213-5930-4.
- Center for Hazards and Risk Research - CHRR - Columbia University, Center for International Earth Science Information Network - CIESIN - Columbia University. 2005. Global Flood Hazard Frequency and Distribution. Palisades, NY: NASA Socioeconomic Data and Applications Center (SEDAC). https://doi.org/10.7927/H4668B3D.
Recente aardbevingen in de buurt
Magnitude 3.0 en hoger
| Datum▼ | Tijd↕ | Magnitude↕ | Distance↕ | Diepte↕ | Locatie↕ | Link |
|---|---|---|---|---|---|---|
| 5/22/19 | 3:48 AM | 3.2 | 55.4 km | 10,000 m | 8km NNE of Winsum, Netherlands | usgs.gov |
| 2/7/13 | 11:19 PM | 3.4 | 58.4 km | 10,000 m | 11km NNE of Winsum, Netherlands | usgs.gov |
| 8/16/12 | 8:30 PM | 3.4 | 59.2 km | 3,000 m | The Netherlands | usgs.gov |
| 10/30/08 | 5:54 AM | 3.3 | 54.8 km | 3,000 m | The Netherlands | usgs.gov |
| 8/8/06 | 5:03 AM | 3.8 | 50.7 km | 10,000 m | The Netherlands | usgs.gov |
| 6/21/04 | 11:32 PM | 3 | 28.8 km | 5,000 m | The Netherlands | usgs.gov |
| 11/10/03 | 12:22 AM | 3.1 | 45 km | 10,000 m | The Netherlands | usgs.gov |
| 2/19/97 | 9:53 PM | 3 | 45.1 km | 5,000 m | The Netherlands | usgs.gov |
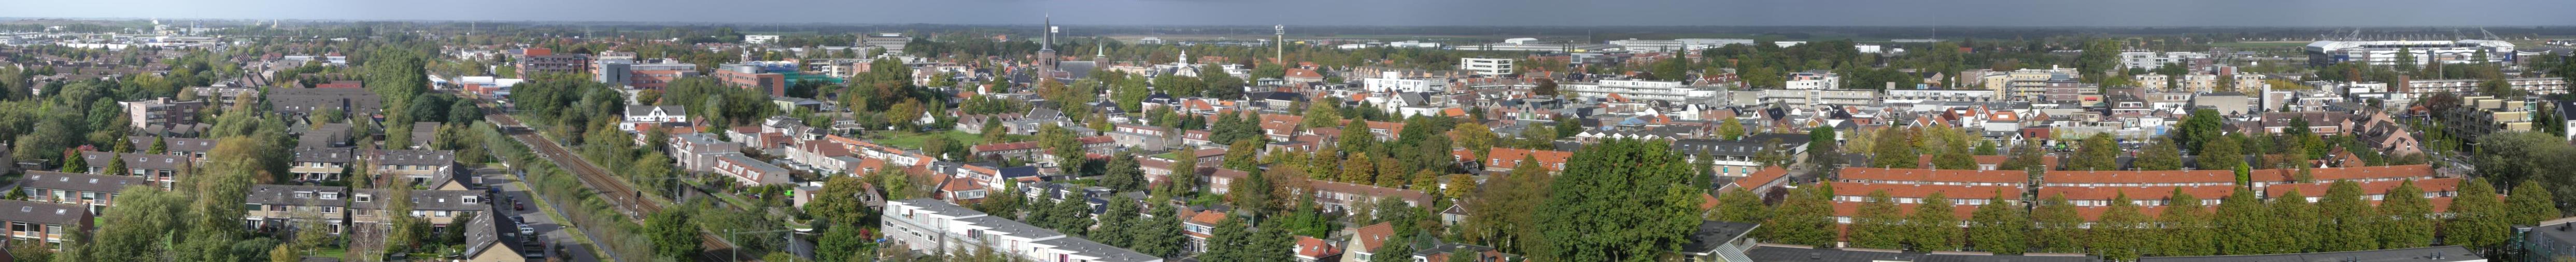
Gorredijk
Gorredijk (Fries: De Gordyk) is het grootste dorp in de gemeente Opsterland, in de Nederlandse provincie Friesland. Het dorp telde in 2015 7.384 inwoners.
Gorredijk Wikipedia Page


Over onze gegevens
De gegevens op deze pagina zijn geschat met behulp van diverse openbaar beschikbare tools en bronnen. Ze worden aangeboden zonder garantie en kunnen onnauwkeurigheden bevatten. Gebruik op eigen risico.