Categorieën in Prigen
AutogarageAutoreparatie en -onderhoudAutowasseretteMotor reparatieLandbouwKledingwinkelsTelecomwinkelTelefoonmaatschappijMoskeeenReligie (Geloof)SoepkeukenElektronica winkelWoningbouwWoningbouwprojectWoonwinkelBasisschoolJunior CollegeOnderwijsOnderwijscentrumToeristische attractieBakkerijenBakso-restaurantBuurtwinkels en supermarktenCafé'sDelicatessenwinkelEetcaféInternetcafé'sKoffieshopNoedelwinkelOntbijt en brunchRestaurantsSnackbarStraatverkopersThee- & Alcoholvrije GelegenhedenKleermakerBankenPIN-automatenBegraafplaatsBarbierKapsalonSchoonheidsalonsCopyshopLandhuisWooncomplexBloemistenGemakswinkelsSupermarktVeehouderijWinkelcentrumWinkelenCampingAccomodatieB&B'sBusstationGastenverblijfHostelsHotelsHotels en motelsReisbureauVillaWoningbouwverenigingOnbereikbaar
Industries
Bedrijfsdistributie per sector in Prigen
| Industrie omschrijving | Aantal bedrijven | Gemiddelde Google-beoordeling |
|---|---|---|
| Restaurants | 59 | 4.3 |
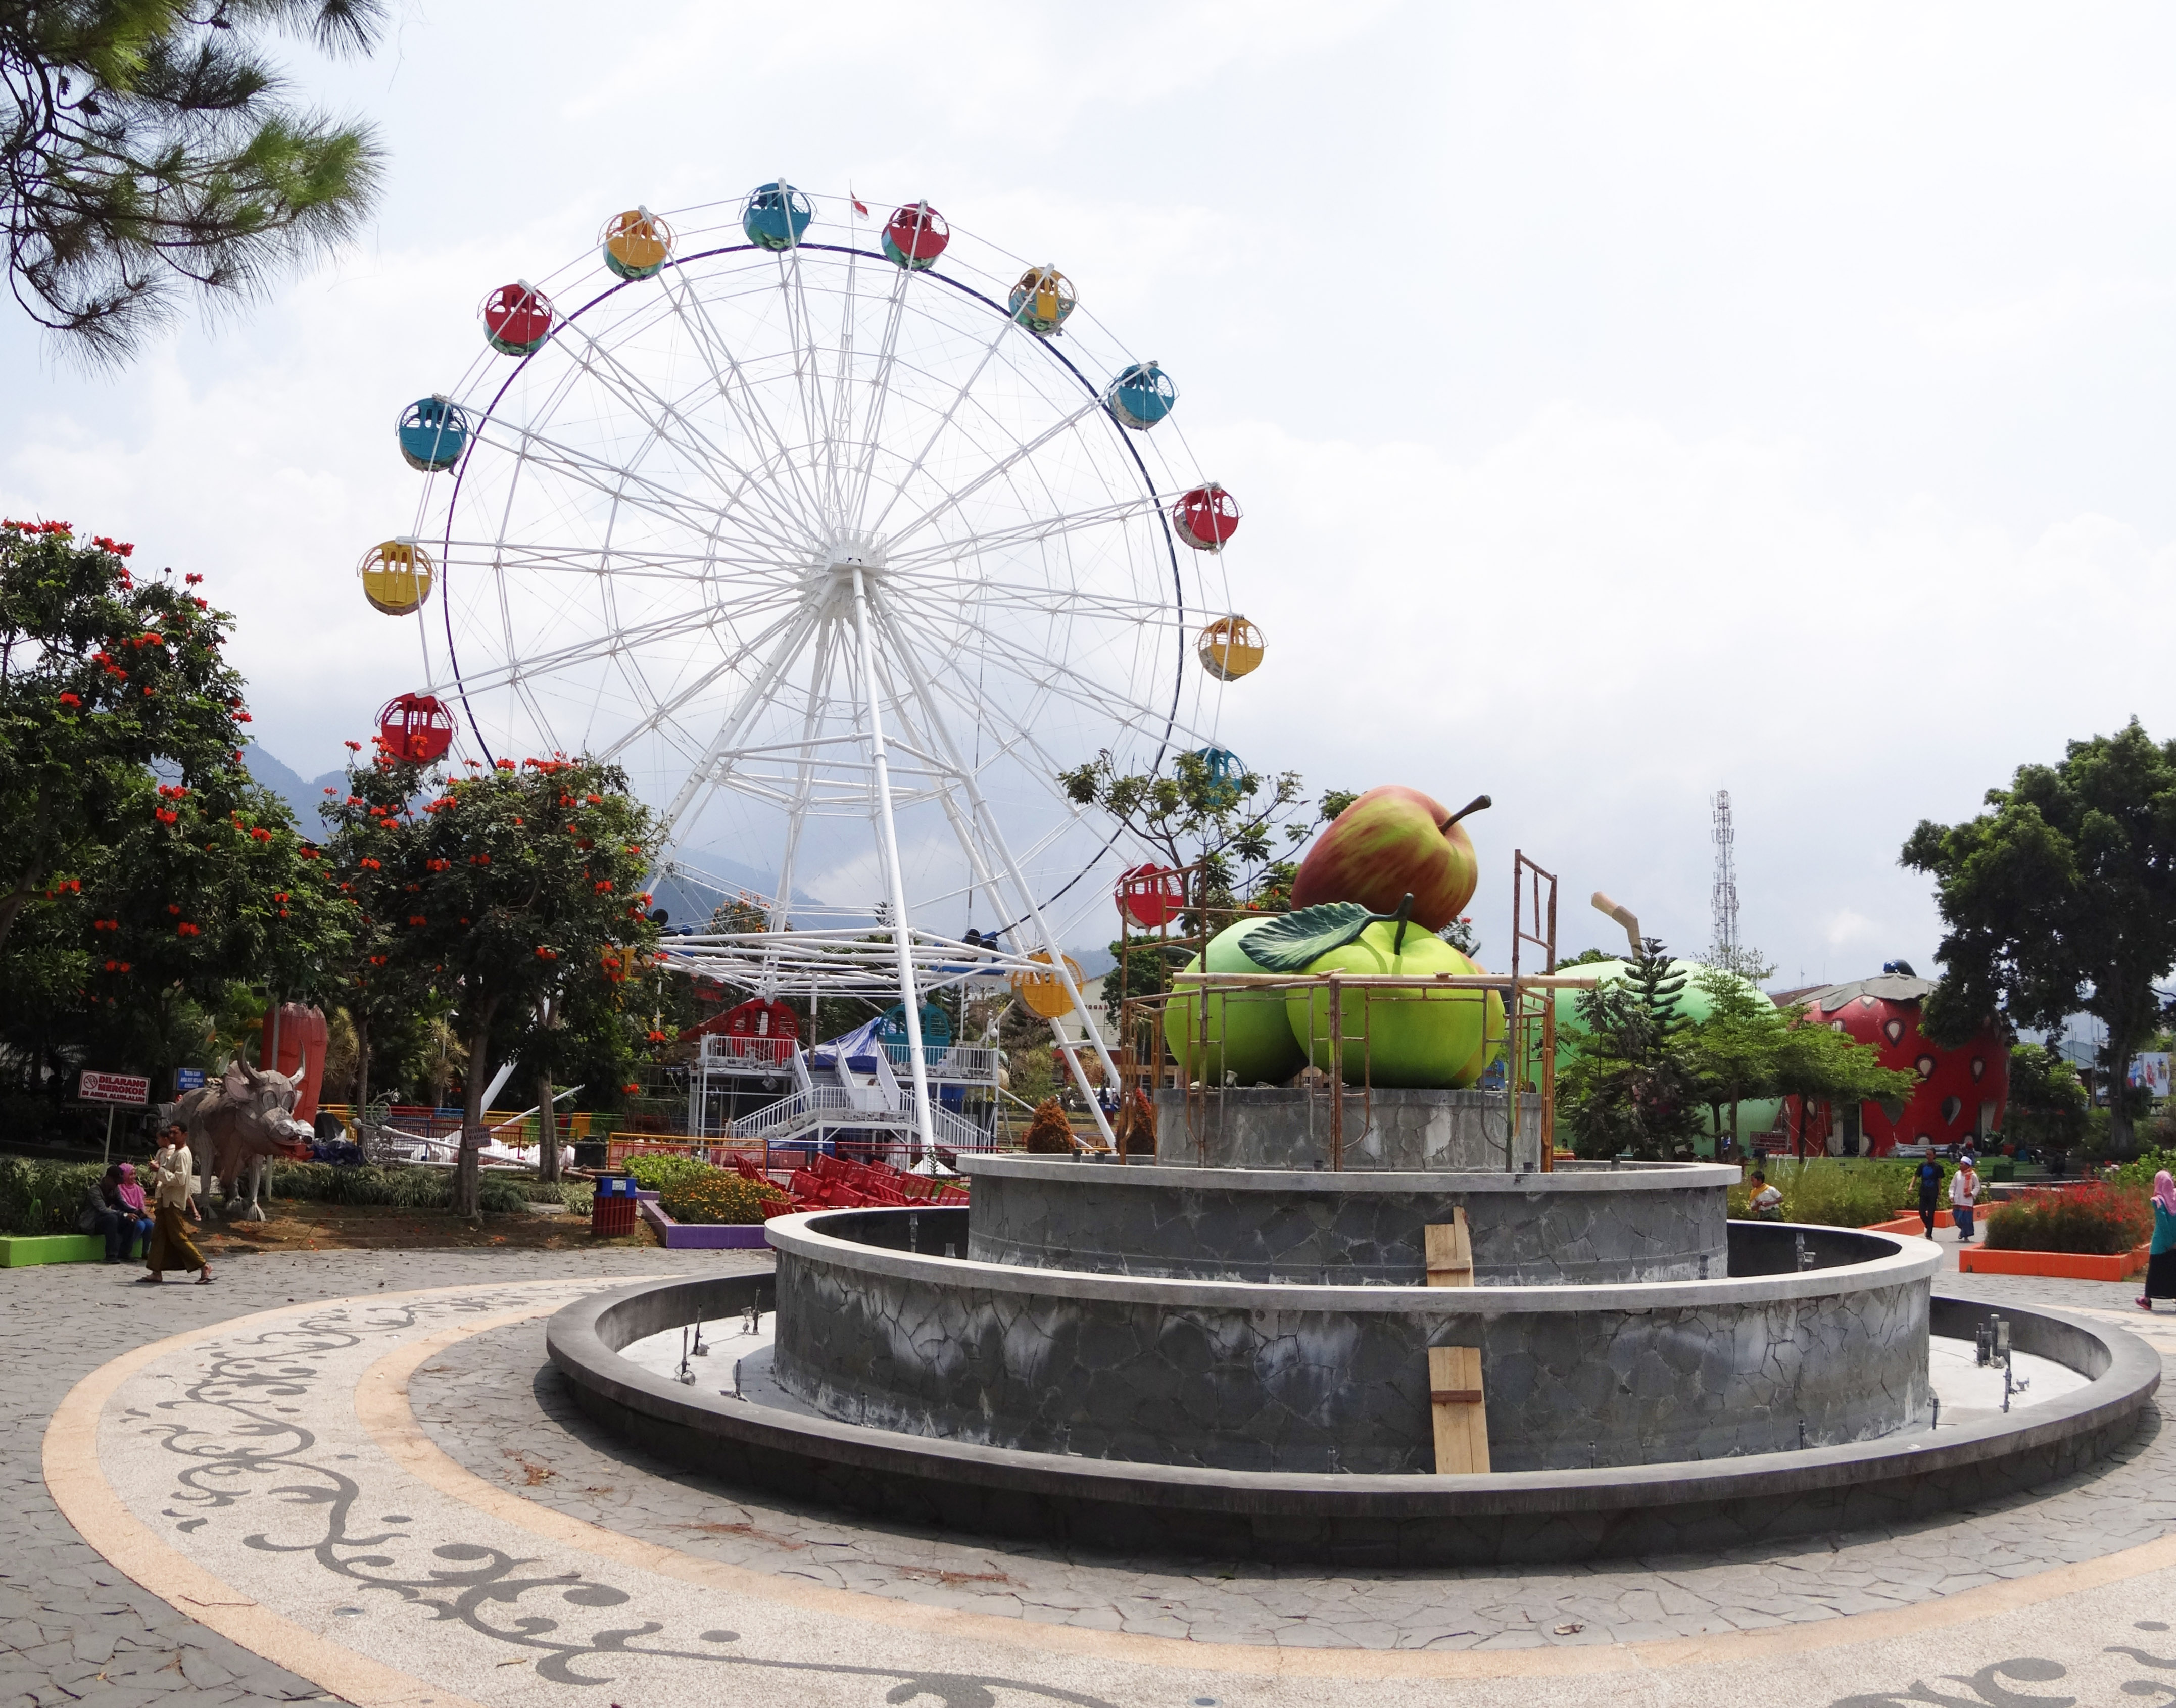
| Sport en vrije tijd | 33 | — |
| Indische restaurants | 26 | — |
| Hotels en motels | 21 | 4 |
| Vakantiehuisjes, chalets en resorts | 17 | 4 |
| Café's | 17 | 4.1 |
| Onroerend Goed | 17 | — |
| Bouw van gebouwen | 16 | — |
| Overige accommodatie | 14 | 4 |
| Campings | 13 | — |
| Amerikaanse restaurants | 12 | 4.3 |
| Aanleg zwembad en sauna | 10 | — |
| Openbare zwembaden | 9 | — |
| Kantoorartikelen | 8 | — |
| Bars en café's | 8 | — |
| Moskeeen | 8 | 4.5 |
| Kunstgalerijen | 7 | — |
| Bejaardentehuizen | 7 | — |
| Woningbouw | 7 | — |
| Hostels | 6 | — |
| Buurtwinkels en supermarkten | 6 | — |
| Kerken | 6 | — |
| Pretparken | 6 | 2 |
| Musea | 6 | — |
| Schouwburg en theaters | 6 | — |
1-25 of 28 tonen...
Feiten over Prigen
| Gebied | 3.0 km² |
| Bevolking | 8.781 |
| Mannelijke bevolking | 4.351 (49.6%) |
| Vrouwelijke bevolking | 4.430 (50.4%) |
| Bevolkingsverandering (1975 to 2020) | +220.5% |
| Bevolkingsverandering (2000 to 2020) | -7.4% |
| Gemiddelde leeftijd | 29.2 jaar (Man: 28.6, Vrouw: 29.7) |
| Buurten | Semeru, Prigen, Airlangga, Gubeng, Duren Sawit, Gading Kasri, Klojen, Manukan Kulon, Tandes |
| Lokale tijd | |
| Tijdzone | West-Indonesische tijd |
| Breedte- & lengtegraad | -7.68333, 112.61667 |
| Postcodes | 67157 |
Kaart van Prigen
Interactieve kaart
Bevolking van Prigen
Jaren 1975 tot 2020
| Data | 1975 | 1990 | 2000 | 2015 | 2020 |
|---|---|---|---|---|---|
| Bevolking | 2.740 | 6.745 | 9.481 | 8.337 | 8.781 |
| Bevolkingsdichtheid | 913,3 / km² | 2.248,3 / km² | 3.160,3 / km² | 2.779 / km² | 2.927 / km² |
Bronnen: JRC (European Commission's Joint Research Centre) werken aan de GHS-bebouwingsraster
Bevolkingsverandering van Prigen van 2000 tot 2015
Daling van 12.1% van jaar 2000 tot 2015
| Locatie | Verandering sinds 1975 | Verandering sinds 1990 | Verandering sinds 2000 |
|---|---|---|---|
| Prigen | +204.3% | +23.6% | -12.1% |
| Oost-Java | +400.7% | +208.6% | +34.2% |
| Indonesië | +96.9% | +41.9% | +21.7% |
Bronnen: JRC (European Commission's Joint Research Centre) werken aan de GHS-bebouwingsraster
Mediane leeftijd in Prigen
Mediane leeftijd: 29.2 jaar
| Locatie | Gemiddelde leeftijd | Mediane leeftijd (vrouw) | Mediane leeftijd (mannelijk) |
|---|---|---|---|
| Prigen | 29.2 yrs | 29.7 yrs | 28.6 yrs |
| Oost-Java | 31.9 yrs | 32.6 yrs | 31.2 yrs |
| Indonesië | 27.2 yrs | 27.5 yrs | 26.9 yrs |
Bronnen: CIESIN (Center for International Earth Science Information Network)
Bevolkingsdichtheid van Prigen
Bevolkingsdichtheid: 2.927 / km²
| Locatie | Bevolking | Gebied | Dichtheid |
|---|---|---|---|
| Prigen | 8.781 | 3 km² | 2.927 / km² |
| Oost-Java | 8.036 | 32,3 km² | 249 / km² |
| Indonesië | 252,8 million | 1.893.657,8 km² | 134 / km² |
Bronnen: JRC (European Commission's Joint Research Centre) werken aan de GHS-bebouwingsraster
Historische en geprojecteerde bevolking van Prigen
Geschatte bevolking van 100 tot 2100
Bronnen:
- JRC (European Commission's Joint Research Centre) werken aan de GHS built-up grid
- CIESIN (Center for International Earth Science Information Network)
- [Link] Klein Goldewijk, K., Beusen, A., Doelman, J., and Stehfest, E.: Anthropogenic land use estimates for the Holocene – HYDE 3.2, Earth Syst. Sci. Data, 9, 927–953, https://doi.org/10.5194/essd-9-927-2017, 2017.
Prijsverdeling
Bedrijfsspreiding voor Prigen
Human Development Index (HDI)
Statistische samengestelde index van levensverwachting, opleiding en inkomen per hoofd van de bevolking.
Bron: [Link] Kummu, M., Taka, M. &Guillaume, J. Gridded global datasets for Gross Domestic Product and Human Development Index over 1990–2015. Sci Data 5, 180004 (2018) doi:10.1038/sdata.2018.4
CO2-uitstoot van Prigen
Kooldioxide (CO2) -emissies per hoofd van de bevolking in ton per jaar
| Locatie | CO2 uitstoot | CO2-uitstoot per hoofd van de bevolking | CO2-emissie-intensiteit |
|---|---|---|---|
| Prigen | 17,660 tn | 2.01 tn | 5,886.8 tons/km² |
| Oost-Java | 10,993 tn | 1.37 tn | 340.4 tons/km² |
| Indonesië | 478,610,416 tn | 1.89 tn | 252.7 tons/km² |
Bronnen: [Link] Moran, D., Kanemoto K; Jiborn, M., Wood, R., Többen, J., and Seto, K.C. (2018) Carbon footprints of 13,000 cities. Environmental Research Letters DOI: 10.1088/1748-9326/aac72a
CO2-uitstoot van Prigen
| CO2-uitstoot 2013 (ton/jaar) | 17,660 tn |
| CO2-uitstoot 2013 (ton/jaar) per hoofd van de bevolking | 2.01 tn |
| CO2-uitstootintensiteit 2013 (ton/km²/jaar) | 5,886.8 tons/km² |
Natuurlijk gevarenrisico
Relative risk out of 10
| Gevaar | Risk Level |
|---|---|
| Drought | Medium (4) |
| Flood | High (10) |
| Earthquake | Medium (6) |
| Landslide | High (8) |
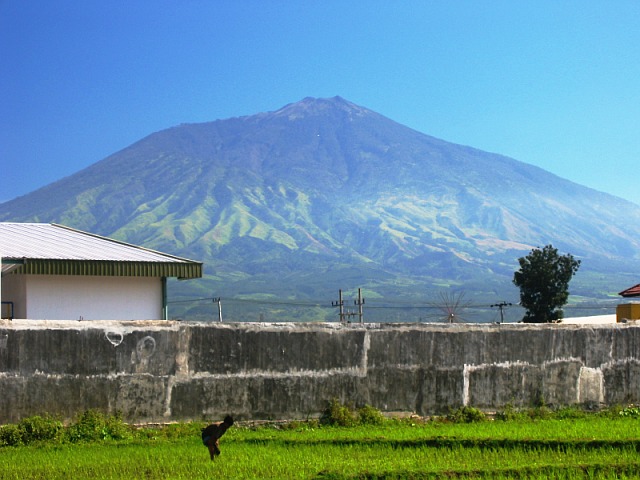
| Volcano | High (10) |
* Risk, particularly concerning flood or landslide, may not be for the entire area.
Bronnen:
- Dilley, M., R.S. Chen, U. Deichmann, A.L. Lerner-Lam, M. Arnold, J. Agwe, P. Buys, O. Kjekstad, B. Lyon, and G. Yetman. 2005. Natural Disaster Hotspots: A Global Risk Analysis. Washington, D.C.: World Bank. https://doi.org/10.1596/0-8213-5930-4.
- Center for Hazards and Risk Research - CHRR - Columbia University, Center for International Earth Science Information Network - CIESIN - Columbia University, and Norwegian Geotechnical Institute - NGI. 2005. Global Landslide Hazard Distribution. Palisades, NY: NASA Socioeconomic Data and Applications Center (SEDAC). https://doi.org/10.7927/H4P848VZ.
- Center for Hazards and Risk Research - CHRR - Columbia University, Center for International Earth Science Information Network - CIESIN - Columbia University, and International Research Institute for Climate and Society - IRI - Columbia University. 2005. Global Drought Hazard Frequency and Distribution. Palisades, NY: NASA Socioeconomic Data and Applications Center (SEDAC). https://doi.org/10.7927/H4VX0DFT.
- Center for Hazards and Risk Research - CHRR - Columbia University, Center for International Earth Science Information Network - CIESIN - Columbia University. 2005. Global Flood Hazard Frequency and Distribution. Palisades, NY: NASA Socioeconomic Data and Applications Center (SEDAC). https://doi.org/10.7927/H4668B3D.
- Center for Hazards and Risk Research - CHRR - Columbia University, Center for International Earth Science Information Network - CIESIN - Columbia University. 2005. Global Volcano Hazard Frequency and Distribution. Palisades, NY: NASA Socioeconomic Data and Applications Center (SEDAC). https://doi.org/10.7927/H4BR8Q45.
- Center for Hazards and Risk Research - CHRR - Columbia University, Center for International Earth Science Information Network - CIESIN - Columbia University. 2005. Global Earthquake Hazard Distribution - Peak Ground Acceleration. Palisades, NY: NASA Socioeconomic Data and Applications Center (SEDAC). https://doi.org/10.7927/H4BZ63ZS.
Recente aardbevingen in de buurt
Magnitude 3.0 en hoger
| Datum▼ | Tijd↕ | Magnitude↕ | Distance↕ | Diepte↕ | Locatie↕ | Link |
|---|---|---|---|---|---|---|
| 7/23/17 | 12:28 PM | 4.3 | 99.1 km | 10,000 m | 8km N of Waru Lor, Indonesia | usgs.gov |
| 4/16/17 | 8:56 PM | 4.1 | 62.8 km | 233,610 m | 18km SSE of Babat, Indonesia | usgs.gov |
| 4/8/17 | 8:17 AM | 3.9 | 48.5 km | 61,710 m | 0km ESE of Bureng, Indonesia | usgs.gov |
| 10/16/16 | 5:45 PM | 4.4 | 40.4 km | 166,430 m | 9km NE of Jombang, Indonesia | usgs.gov |
| 10/11/16 | 11:47 AM | 4 | 85.7 km | 144,390 m | 9km ESE of Krajan Tambakrejo, Indonesia | usgs.gov |
| 9/23/16 | 11:33 PM | 4.2 | 93.5 km | 150,370 m | 5km WSW of Tiang, Indonesia | usgs.gov |
| 9/8/15 | 1:06 AM | 4 | 86.1 km | 31,020 m | 5km S of Pujiharjo, Indonesia | usgs.gov |
| 7/9/15 | 7:47 PM | 4 | 99.7 km | 82,370 m | 26km S of Krajan Srigonco, Indonesia | usgs.gov |
| 6/25/15 | 3:35 AM | 4.3 | 96.4 km | 9,770 m | 20km NW of Nganjuk, Indonesia | usgs.gov |
| 3/10/15 | 11:31 PM | 4.3 | 92.2 km | 122,820 m | 18km S of Gombangan, Indonesia | usgs.gov |
Over onze gegevens
De gegevens op deze pagina zijn geschat met behulp van diverse openbaar beschikbare tools en bronnen. Ze worden aangeboden zonder garantie en kunnen onnauwkeurigheden bevatten. Gebruik op eigen risico.