Categorieën in Manado
Industries
Bedrijfsdistributie per sector in Manado
| Industrie omschrijving | Aantal bedrijven | Gemiddelde Google-beoordeling |
|---|---|---|
| Restaurants | 1,871 | 4.4 |
| Winkelen | 1,503 | 4.5 |
| Kantoorartikelen | 1,476 | 4.5 |
| Onderwijs | 946 | 4.4 |
| Kerken | 844 | 4.6 |
| Bouw van gebouwen | 829 | 4.5 |
| Ziekenhuizen | 632 | 4 |
| Indische restaurants | 614 | 4.3 |
| Onroerend Goed | 573 | 4.3 |
| Sport en vrije tijd | 542 | 4.2 |
| Café's | 514 | 4.5 |
| Voortgezet onderwijs | 511 | 4.4 |
| Hoger Onderwijs (HBO en WO) | 505 | 4.4 |
| Openbaar bestuur | 478 | 4.3 |
| Religie (Geloof) | 430 | 4.6 |
| Electronicawinkel | 383 | 4.5 |
| Banken | 373 | 4.3 |
| Lening Bedrijven | 371 | 4.3 |
| Amerikaanse restaurants | 364 | 4.4 |
| Medisch en gezondheid | 324 | 4.3 |
| Automobiel | 275 | 4.2 |
| Buurtwinkels en supermarkten | 268 | 4.4 |
| Woningbouw | 261 | 4.3 |
| Alle eten en drinken | 236 | 4.4 |
| Gehoor | 225 | 4.1 |
Feiten over Manado
| Gebied | 426.4 km² |
| Bevolking | 635.405 |
| Mannelijke bevolking | 320.042 (50.4%) |
| Vrouwelijke bevolking | 315.363 (49.6%) |
| Bevolkingsverandering (1975 to 2020) | +120.6% |
| Bevolkingsverandering (2000 to 2020) | +30.5% |
| Gemiddelde leeftijd | 28.2 jaar (Man: 27.8, Vrouw: 28.7) |
| Netnummers | 43 |
| Buurten | Pinaesaan, Wenang, Wenang Utara, Wenang, Manado, Teling Atas, Wanea, Malalayang Satu, Malalayang |
| Lokale tijd | |
| Tijdzone | Centraal-Indonesische tijd |
| Breedte- & lengtegraad | 1.48218, 124.84892 |
| Postcodes | 95111, 95112, 95113, 95114, 95115, More |
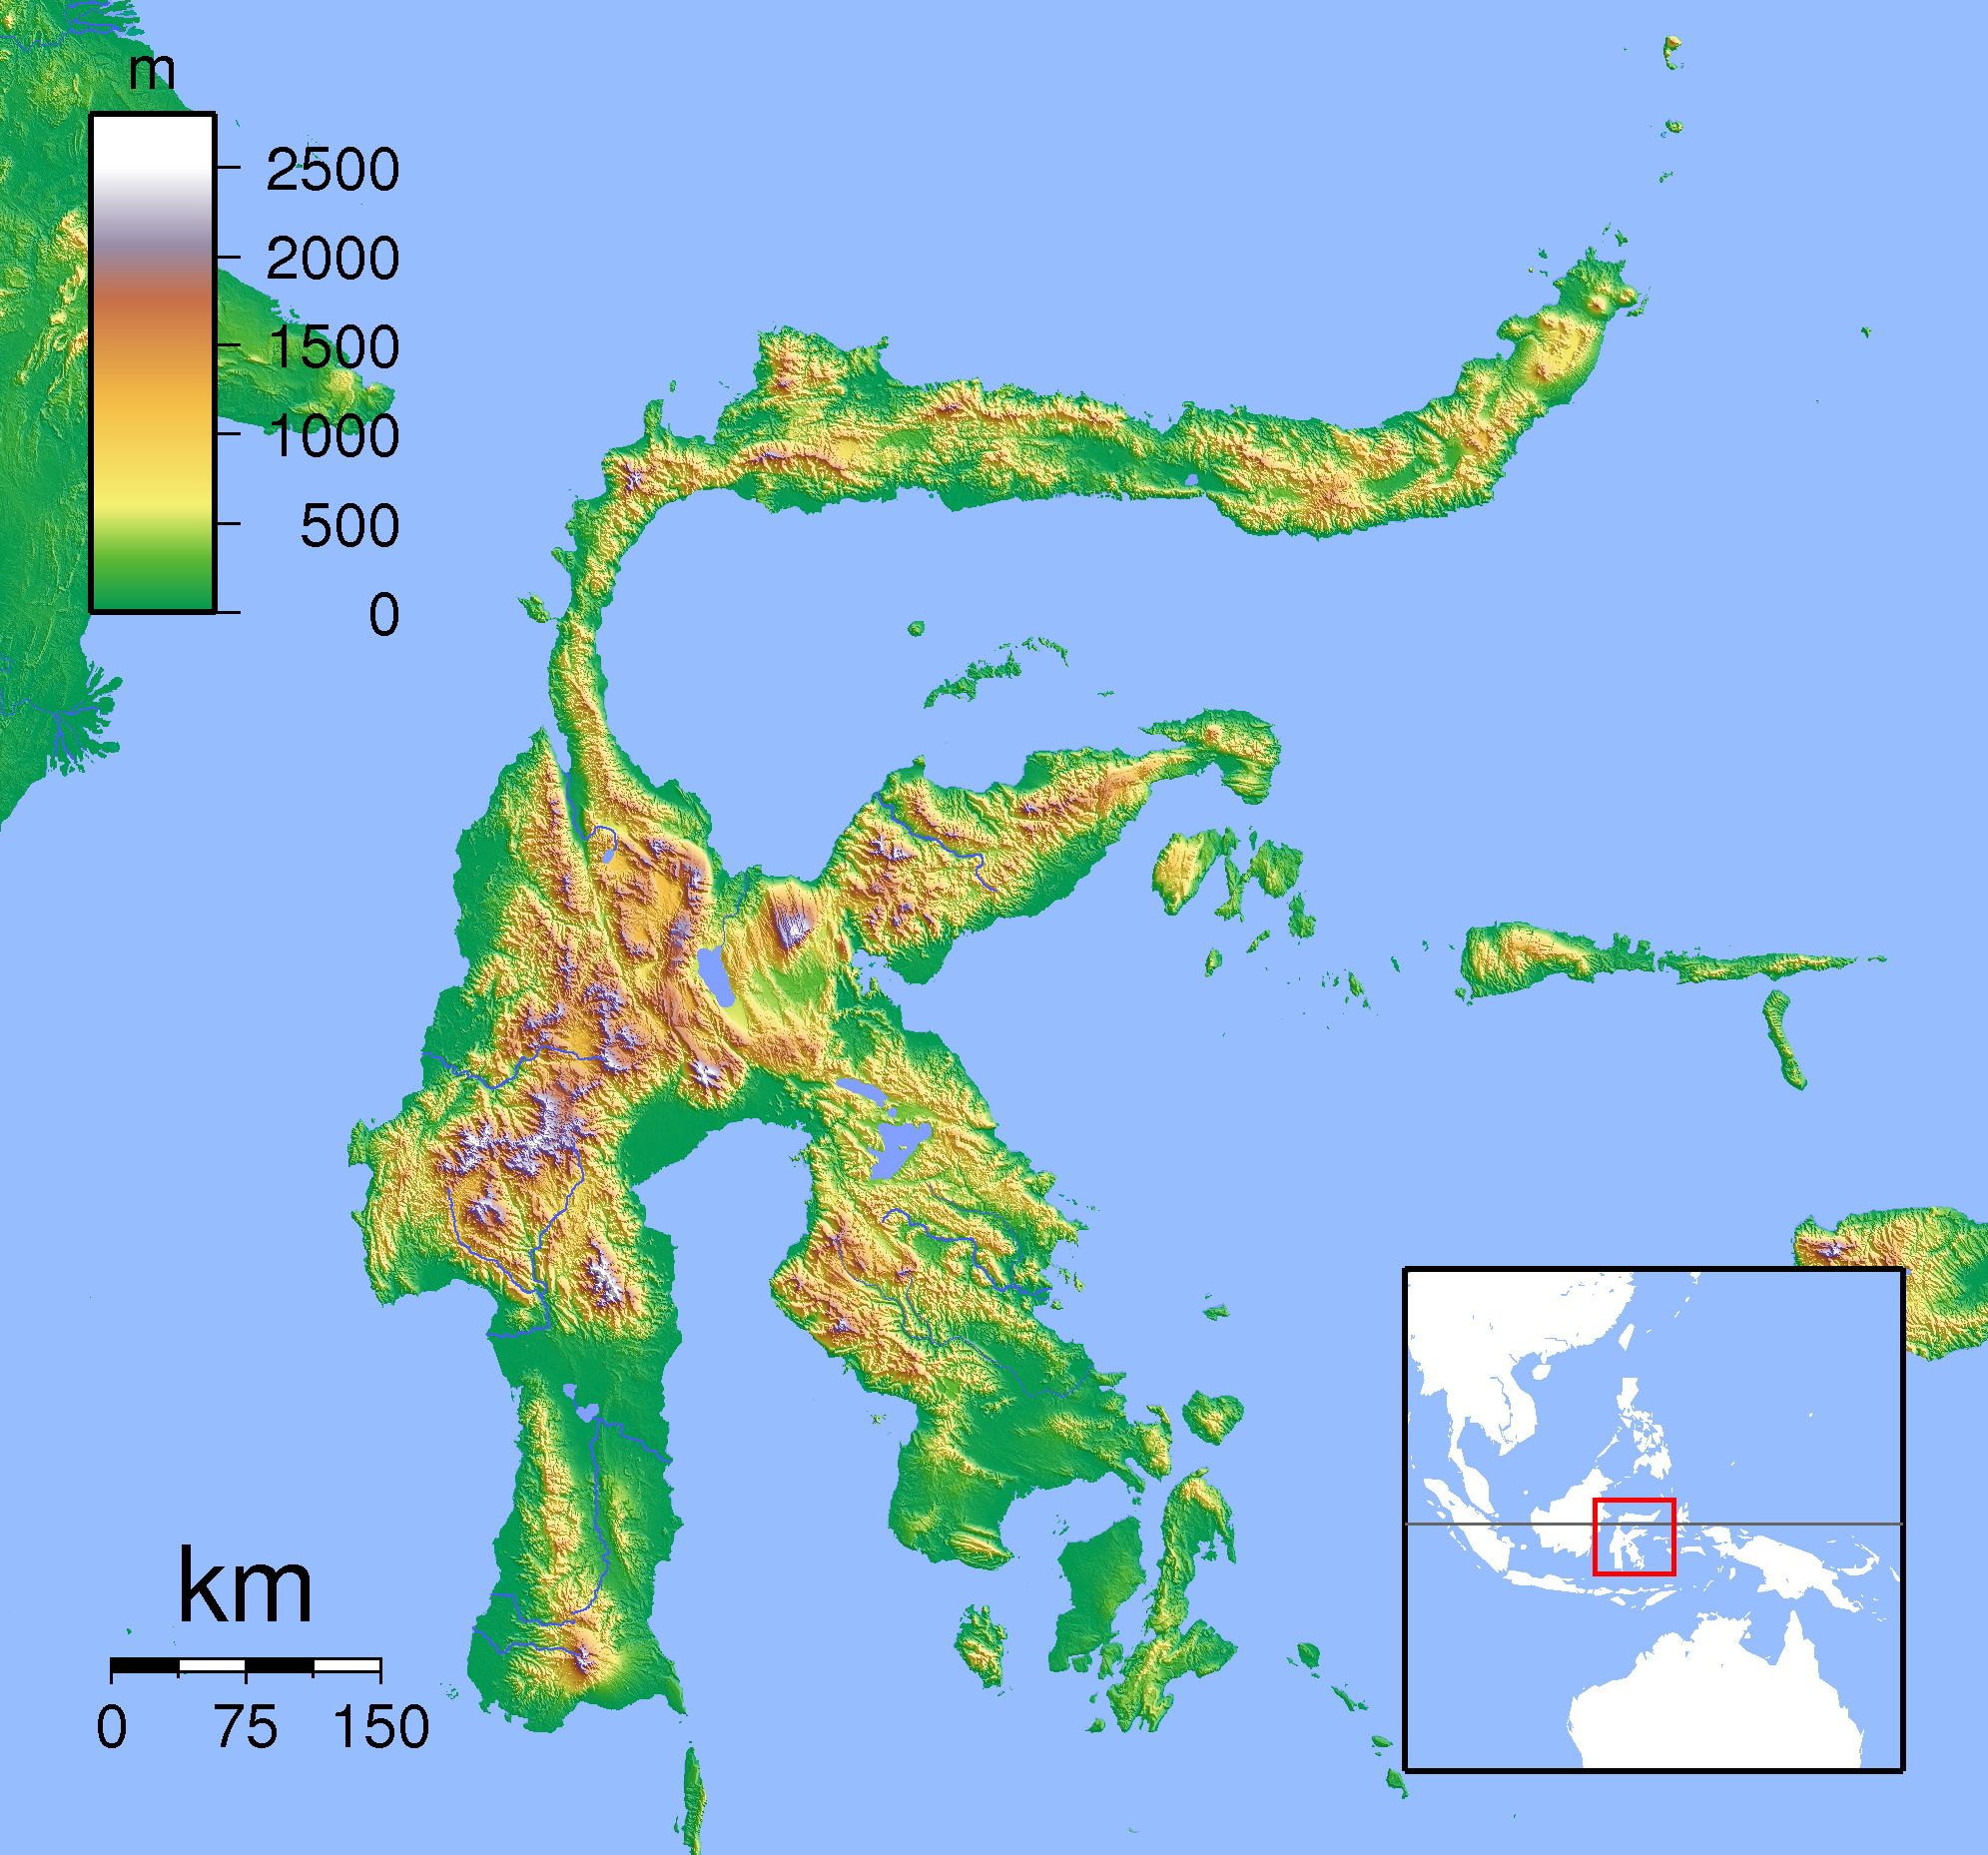
Kaart van Manado
Interactieve kaart
Bevolking van Manado
Jaren 1975 tot 2020
| Data | 1975 | 1990 | 2000 | 2015 | 2020 |
|---|---|---|---|---|---|
| Bevolking | 288.070 | 409.979 | 486.854 | 605.767 | 635.405 |
| Bevolkingsdichtheid | 675,5 / km² | 961,4 / km² | 1.141,7 / km² | 1.420,5 / km² | 1.490 / km² |
Bevolkingsverandering van Manado van 2000 tot 2015
Stijging van 24.4% van jaar 2000 tot 2015
| Locatie | Verandering sinds 1975 | Verandering sinds 1990 | Verandering sinds 2000 |
|---|---|---|---|
| Manado | +110.3% | +47.8% | +24.4% |
| Noord-Celebes | +161% | +67.6% | +34.2% |
| Indonesië | +96.9% | +41.9% | +21.7% |
Mediane leeftijd in Manado
Mediane leeftijd: 28.2 jaar
| Locatie | Gemiddelde leeftijd | Mediane leeftijd (vrouw) | Mediane leeftijd (mannelijk) |
|---|---|---|---|
| Manado | 28.2 yrs | 28.7 yrs | 27.8 yrs |
| Noord-Celebes | 29.1 yrs | 29.5 yrs | 28.7 yrs |
| Indonesië | 27.2 yrs | 27.5 yrs | 26.9 yrs |
Bevolkingsdichtheid van Manado
Bevolkingsdichtheid: 1.490 / km²
| Locatie | Bevolking | Gebied | Dichtheid |
|---|---|---|---|
| Manado | 635.405 | 426,4 km² | 1.490 / km² |
| Noord-Celebes | 2,4 million | 14.665,5 km² | 161 / km² |
| Indonesië | 252,8 million | 1.893.657,8 km² | 134 / km² |
Historische en geprojecteerde bevolking van Manado
Geschatte bevolking van 1830 tot 2100
- JRC (European Commission's Joint Research Centre) werken aan de GHS built-up grid
- CIESIN (Center for International Earth Science Information Network)
- [Link] Klein Goldewijk, K., Beusen, A., Doelman, J., and Stehfest, E.: Anthropogenic land use estimates for the Holocene – HYDE 3.2, Earth Syst. Sci. Data, 9, 927–953, https://doi.org/10.5194/essd-9-927-2017, 2017.
Wijken in Manado
Percentage bedrijven per wijk in Manado
Netnummers
Percentage gebiedscodes gebruikt door bedrijven in Manado
Postcodes
Percentage bedrijven per postcode in Manado
Prijsverdeling
Bedrijfsspreiding voor Manado
Human Development Index (HDI)
Statistische samengestelde index van levensverwachting, opleiding en inkomen per hoofd van de bevolking.
CO2-uitstoot van Manado
Kooldioxide (CO2) -emissies per hoofd van de bevolking in ton per jaar
| Locatie | CO2 uitstoot | CO2-uitstoot per hoofd van de bevolking | CO2-emissie-intensiteit |
|---|---|---|---|
| Manado | 863,892 tn | 1.36 tn | 2,025.8 tons/km² |
| Noord-Celebes | 4,296,994 tn | 1.82 tn | 293 tons/km² |
| Indonesië | 478,610,416 tn | 1.89 tn | 252.7 tons/km² |
| CO2-uitstoot 2013 (ton/jaar) | 863,892 tn |
| CO2-uitstoot 2013 (ton/jaar) per hoofd van de bevolking | 1.36 tn |
| CO2-uitstootintensiteit 2013 (ton/km²/jaar) | 2,025.8 tons/km² |
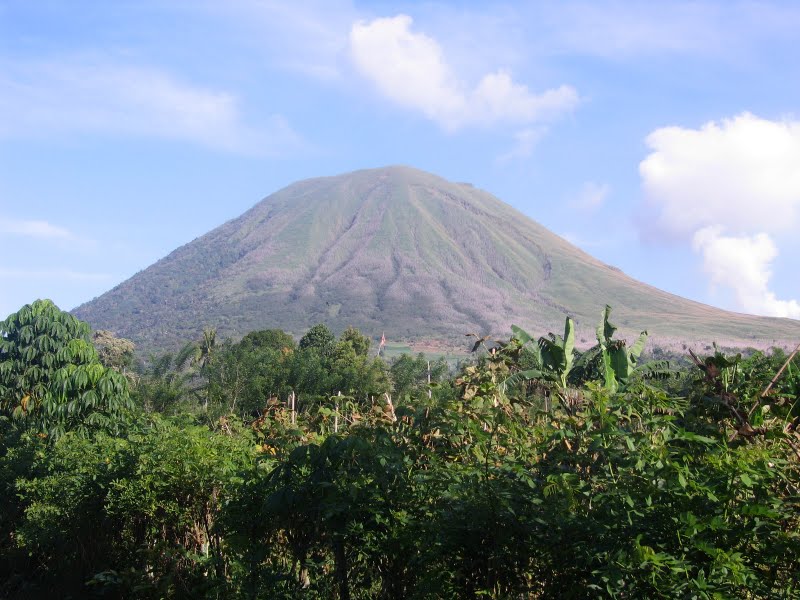
Natuurlijk gevarenrisico
Relative risk out of 10
| Gevaar | Risk Level |
|---|---|
| Drought | High (7.1) |
| Flood | Medium (4) |
| Earthquake | Medium (5.3) |
| Landslide | High (9) |
| Volcano | High (9) |
* Risk, particularly concerning flood or landslide, may not be for the entire area.
- Dilley, M., R.S. Chen, U. Deichmann, A.L. Lerner-Lam, M. Arnold, J. Agwe, P. Buys, O. Kjekstad, B. Lyon, and G. Yetman. 2005. Natural Disaster Hotspots: A Global Risk Analysis. Washington, D.C.: World Bank. https://doi.org/10.1596/0-8213-5930-4.
- Center for Hazards and Risk Research - CHRR - Columbia University, Center for International Earth Science Information Network - CIESIN - Columbia University, and Norwegian Geotechnical Institute - NGI. 2005. Global Landslide Hazard Distribution. Palisades, NY: NASA Socioeconomic Data and Applications Center (SEDAC). https://doi.org/10.7927/H4P848VZ.
- Center for Hazards and Risk Research - CHRR - Columbia University, Center for International Earth Science Information Network - CIESIN - Columbia University, and International Research Institute for Climate and Society - IRI - Columbia University. 2005. Global Drought Hazard Frequency and Distribution. Palisades, NY: NASA Socioeconomic Data and Applications Center (SEDAC). https://doi.org/10.7927/H4VX0DFT.
- Center for Hazards and Risk Research - CHRR - Columbia University, Center for International Earth Science Information Network - CIESIN - Columbia University. 2005. Global Flood Hazard Frequency and Distribution. Palisades, NY: NASA Socioeconomic Data and Applications Center (SEDAC). https://doi.org/10.7927/H4668B3D.
- Center for Hazards and Risk Research - CHRR - Columbia University, Center for International Earth Science Information Network - CIESIN - Columbia University. 2005. Global Volcano Hazard Frequency and Distribution. Palisades, NY: NASA Socioeconomic Data and Applications Center (SEDAC). https://doi.org/10.7927/H4BR8Q45.
- Center for Hazards and Risk Research - CHRR - Columbia University, Center for International Earth Science Information Network - CIESIN - Columbia University. 2005. Global Earthquake Hazard Distribution - Peak Ground Acceleration. Palisades, NY: NASA Socioeconomic Data and Applications Center (SEDAC). https://doi.org/10.7927/H4BZ63ZS.
Recente aardbevingen in de buurt
Magnitude 3.0 en hoger
| Datum▼ | Tijd↕ | Magnitude↕ | Distance↕ | Diepte↕ | Locatie↕ | Link |
|---|---|---|---|---|---|---|
| 4/18/19 | 9:31 PM | 4.5 | 45.6 km | 170,050 m | 25km N of Bitung, Indonesia | usgs.gov |
| 10/13/18 | 4:34 AM | 5.2 | 51.4 km | 97,150 m | 16km ENE of Bitung, Indonesia | usgs.gov |
| 7/13/18 | 2:29 AM | 4.6 | 38.7 km | 227,990 m | 36km W of Tomohon, Indonesia | usgs.gov |
| 4/2/18 | 7:23 PM | 4.6 | 20.3 km | 193,710 m | 17km NNW of Laikit, Laikit II (Dimembe), Indonesia | usgs.gov |
| 2/20/18 | 9:29 AM | 4.8 | 53.4 km | 220,060 m | 53km W of Manado, Indonesia | usgs.gov |
| 8/27/17 | 7:51 PM | 4.2 | 46.9 km | 235,650 m | 46km NNW of Manado, Indonesia | usgs.gov |
| 8/21/17 | 11:31 PM | 4.5 | 47.4 km | 134,190 m | 27km S of Tondano, Indonesia | usgs.gov |
| 7/19/17 | 5:04 PM | 4.9 | 46.2 km | 177,060 m | 45km N of Manado, Indonesia | usgs.gov |
| 10/10/16 | 8:24 AM | 4.1 | 16.1 km | 550,800 m | 15km N of Manado, Indonesia | usgs.gov |
| 9/27/16 | 9:35 AM | 4.1 | 15.9 km | 35,000 m | 6km WNW of Tomohon, Indonesia | usgs.gov |
Manado
Manado, in de koloniale tijd Menado genoemd, is de hoofdstad van de provincie Noord-Celebes (Sulawesi Utara) op het eiland Celebes (Sulawesi) dat deel uitmaakt van Indonesië. Er wonen ongeveer 500.000 mensen in het vrijwel geheel christelijke Manado. Het is ee..
Manado Wikipedia Page

Over onze gegevens
De gegevens op deze pagina zijn geschat met behulp van diverse openbaar beschikbare tools en bronnen. Ze worden aangeboden zonder garantie en kunnen onnauwkeurigheden bevatten. Gebruik op eigen risico.